

Introduction
This website is dedicated to presenting climate trends in Denver Colorado. It is well established that we are currently in a warming trend globally. I started this website because I was curious about what amount (if any) of global warming was evident in the climate history of the place I live. It seems like the summers are hotter, with many new record highs reported over the past few years, but I wanted to see some easy to read plots that showed the actual trends. I found that the more accessible web pages with colorful, easy to read plots were about current weather or future weather. So, I did some investigation on the NWS web-site and the Meso-West web site and put together a few of my own plots that the layperson can use to quickly see trends.
Temperature Trends in Denver
Here are the average yearly temperatures in Denver since 1995.
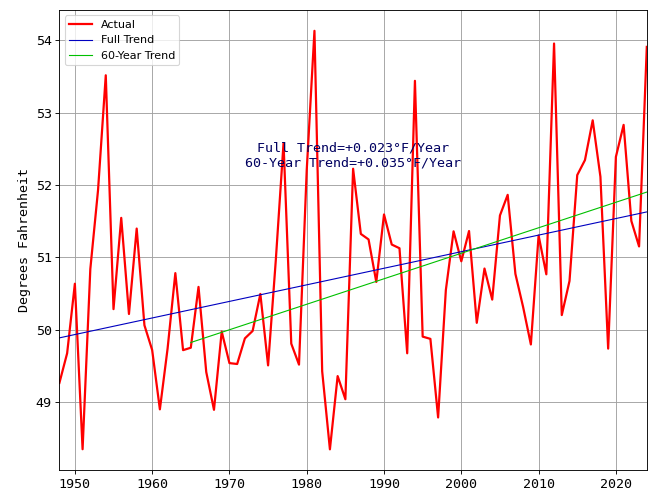
As you can see, this does show an increase in average temperatures as expected. The average temperature for the year does bounce around a bit but, you can visually tell that there is a slight upward trend. In fact, superimposed on this plot is the linear fit for all the years (1995 to present) and the exact temperature trend in degrees/year. The values may seem small but if it continues at this rate, in 100 years Denver will have record highs well above 110 degrees!
Please check out the average and extreme temperature pages. These pages include plots with temperatures for this year (updated daily) and the past years dating back to 1995. For finer resolution on temperature history, check out the hourly temperatures page.
Precipitation in Denver
As alarming as the temperature trend is, the precipitation trend is also shocking, especially as this area is already a semi-arid climate. This plot shows the total yearly precipitation dating back to 1995.
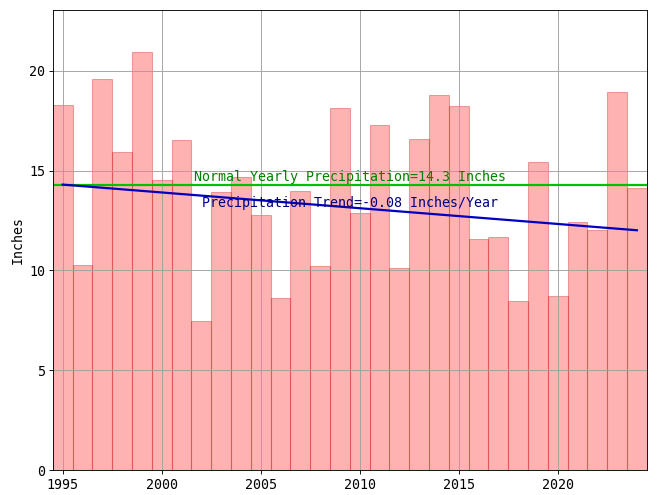
As you can see, we have had a majority of years below normal precipitation and had a stretch of 7 straight years below normal (from 2002 to 2008). In 2002, we got around half the normal precipitation. Most of the reports we see about precipitation are concerned with the amount of snowfall in the mountains, because the run-off reservoirs supply the metropolitan area with their needed water. Of course this is important, but I am also concerned about the amount of precipitation in the foothills and the plains. If this trend continues, we could soon be living in the desert!
Please check out the precipitation page. This page includes plots showing the total precipitation throughout the year. You can see plots for this year (updated daily) and previous years dating back to 1995.
Summary
This website shows definitive and non-subjective data about climate changes in Denver. There is definitely a trend to warmer temperatures and less precipitation. Global warming effects different areas of the world differently, so this data is specific to the local effect in Denver. As to why we are experiencing climate change, I am not going to speculate. I'm sure a Google search will produce plenty of opinion on that matter. I am just presenting the facts.